Welcome
modules No. 1Why Use Research Analysts?
modules No. 2Benefits Of Using Research Analysts
modules No. 3Introduction To Our Platform: Chart+
modules No. 4Getting Familiar With Trader Views
modules No. 5How To Use Trader Views
modules No. 6Price Action Analysis Recap
modules No. 7Identifying Areas of Support
modules No. 8Identifying Areas of Resistance
modules No. 9Using Moving Averages to Show Trend Bias
modules No. 10Using Moving Averages To Show Turning Points
modules No. 11Using the RSI Indicator
modules No. 12RSI Convergence and Divergence
modules No. 13Using the MACD Indicator
modules No. 14Bollinger Bands Introduction
modules No. 15Pairing the RSI and Bollinger Bands
modules No. 16Pivot Points Introduction
modules No. 17Pre-Trade Execution Readiness
modules No. 18Entry Execution
modules No. 19Stop Loss
modules No. 20Take Profit
modules No. 21Managing Trades
modules No. 22Reviewing Your Performance
modules No. 23Research Analyst Trading Examples
modules No. 24BONUS – Using Patterns To Your Advantage
modules No. 25Final Thoughts & Wrap Up
modules No. 26Next Steps
modules No. 27Quiz
modules No. 28Price Action Analysis Recap
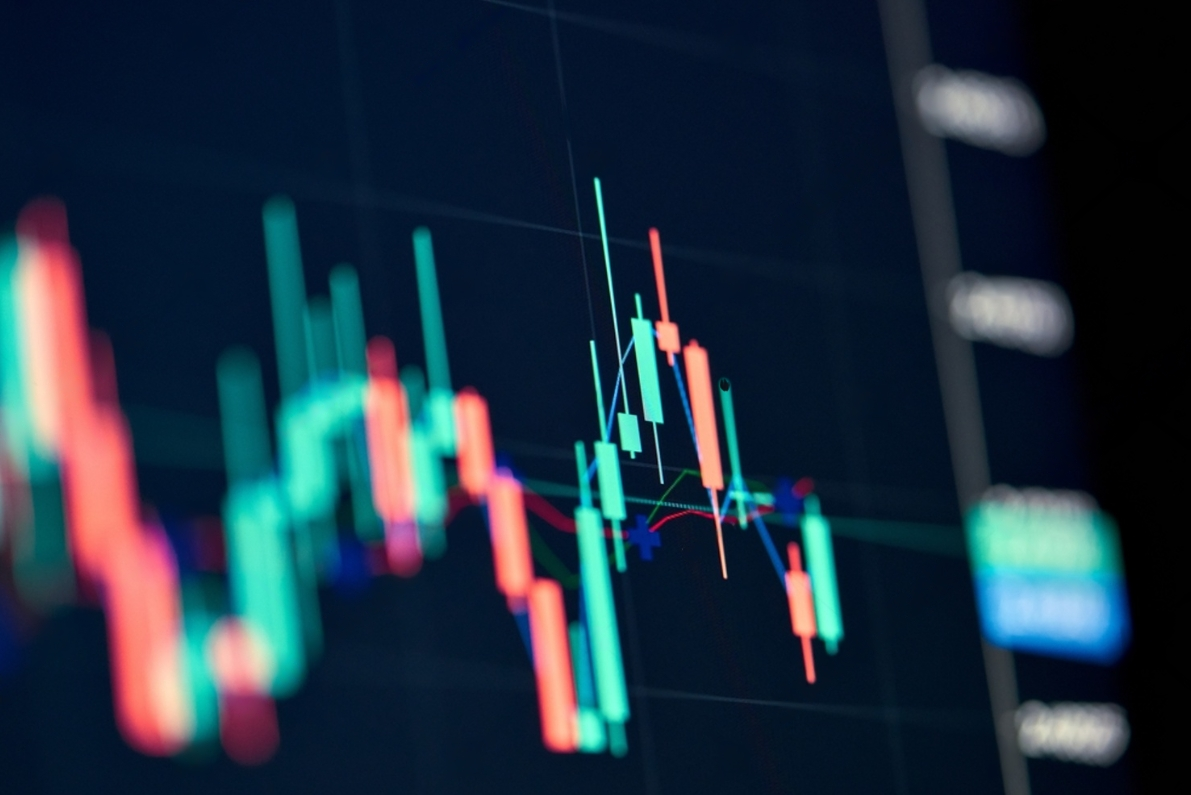
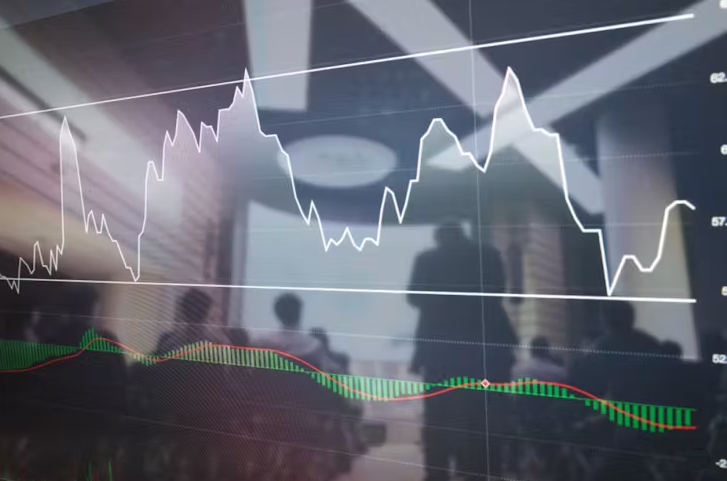
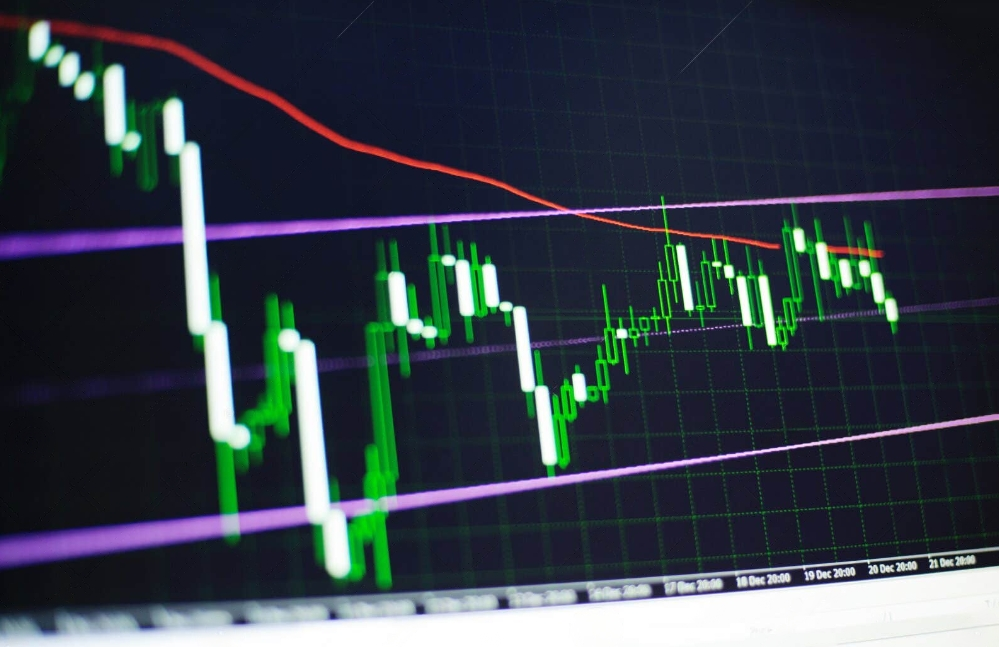
In this video we will recap the intricate world of price action and decipher market trends and patterns. Understanding price action is essential for conducting thorough technical analysis and devising effective trading strategies. Throughout this video, we will explore the nuances of identifying various market movements, from uptrends and downtrends to shifts in trend direction and periods of consolidation within price structures. As a trader, mastering the art of reading price action on a chart will undoubtedly emerge as one of your most invaluable skills. By honing this skill, you'll gain a deeper insight into market dynamics and be better equipped to make informed trading decisions in diverse market conditions. Join us as we recap the fundamentals of price action and equip you with the knowledge you need.