


Beginner Trader
modules No. 5
 Gavin Gerrits
Gavin Gerrits
Navigating a Chart
Navigating a Chart
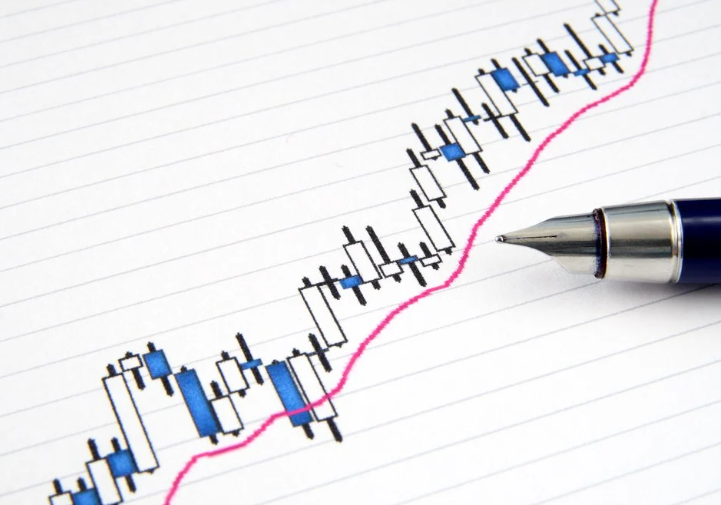
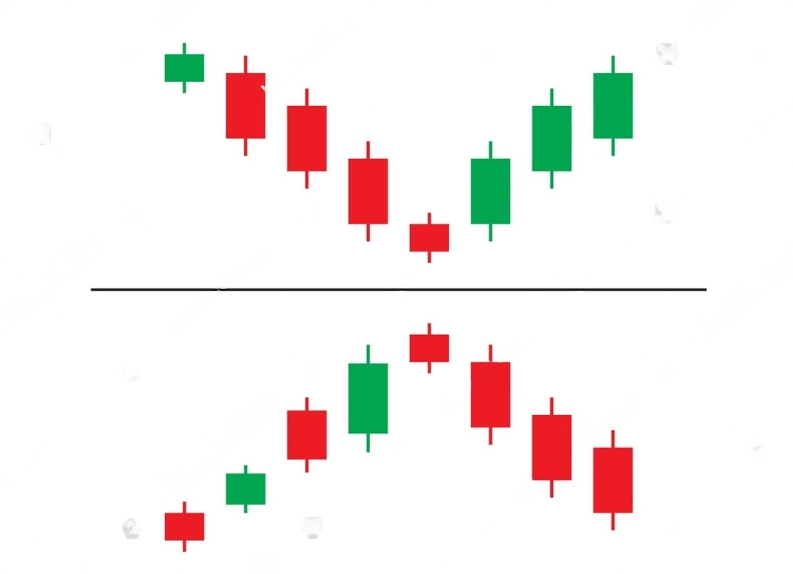
Discover the fundamentals of a trading chart, from candlestick bar structures to timeframes, and then to the price on the y-axis and the time on the x-axis. We will thoroughly investigate how to interpret the chart, utilising the x and y axes as guiding references. Subsequently, we will delve deeper into candlesticks, distinguishing between a green bullish bar and a red bearish one. Furthermore, we will embark on an exploration of timeframes, comprehending how these intervals compress the price action displayed on the chart, offering insights into short-term fluctuations and long-term trends. Through this comprehensive examination, we aim to equip traders with the key fundamental information they need.